Your co-op is in the housing business, not the lending business. If a household doesn’t pay what it owes and moves out, you’re left with a bad debt, which will have to be covered by your other members. It is important for your co-op to keep arrears to a minimum and even better, to keep them at zero!

The Agency recognizes the negative impact that arrears and bad debts can have on a co-op, and over the years, we have continuously encouraged our clients to adopt good practices to keep arrears at a minimum. On our website, we provide tools to help our co-ops manage arrears and on our HomeRun site, co-ops can find good practice stories from other co-ops and even see how they measure up against their peers.
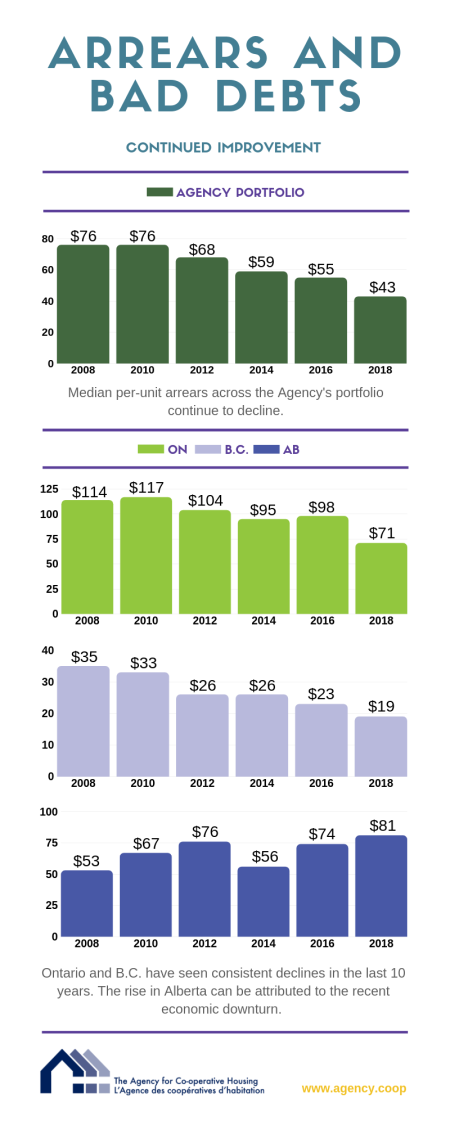
So what does all this add up to? Well, we’re glad you asked. We are very pleased to report that over the last decade, arrears and bad debts across our portfolio have declined considerably. In 2007, the median combined year-end arrears and annual bad-debt expenses for our whole portfolio were $83 per unit. At the end of 2018, they had dropped to $43 per unit – that’s a 48% decline! And that’s not all! Wait until you read about the progress our co-ops have made when it comes to directors in arrears.
Interested in learning more about how our client co-ops’ arrears situation has improved over the years? Check out our 2018 Biannual Portfolio Performance Report. In this report, we dig a little deeper and look at arrears and bad-debt expenses in a variety of different ways, including breaking it down provincially. For example, while we have seen consistent declines in Ontario and BC, the story is a little different in Alberta, where the province is still recovering from a recent economic downturn.